How many organisations spring to mind where you know their target year for net zero, their plans to achieve it and how they're tracking against their goal?
How many describe their achievements in terms of a ‘percentage reduction', a ‘tonnage reduced', or ‘not being on track'? The lack of context in statements like these fails to frame progress in a way that is understandable to non-experts. it's also less meaningful in conveying what has been achieved, or the pace at which behavioural change is needed.
Using trend data and projecting net zero attainment dates in a more visual format can make for an easier framing of current performance, progress on meeting targets, and the behaviour required to accelerate action.
Only last year, more than one in five UK councils had no climate action plan in place. And although local authorities are starting to address this, plans are only one part of the equation. There's an urgent case for delving deeper into how councils are progressing against goals, and, just as importantly, how exactly they're communicating that progress to their stakeholders, including the general public.
Performance, not promises
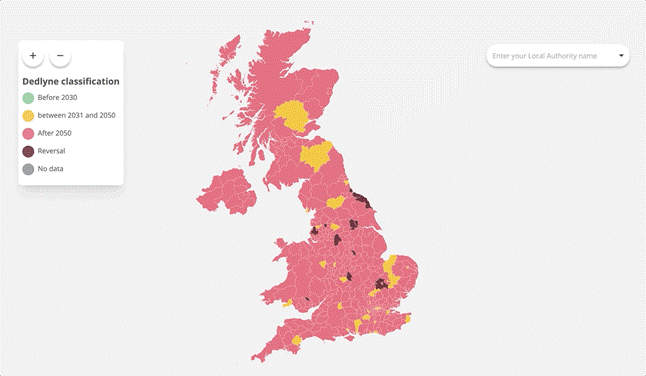
Compelling visual data is key to this challenge, but often hard to find. In response, a new tool by dedlyne and infogr8 (sustainability and visual data specialists) is set to simplify how councils communicate their progress on net zero targets. Analysing performance trend data, rather than promises or plans, and expressing results in a simple Red-Amber-Green dial, the interactive dedlynetracker communicates when each of the UK's 374 local authorities is projected to hit net zero, and how that stacks up against the UK's overall target of 2050.
It reveals that based on the latest UK government data from the Department of Energy Security and Net Zero (2017-2021), only 10% of local authorities are on track to deliver on time, and the UK overall is currently projected to meet net zero by 2062. A sobering thought.
Of the 374 local authorities, 59 are projected not to hit net zero this century, with 11 of those needing to reverse trends to project a date.
Having access to a visual tracking tool helps to remove the layers of complexity surrounding net zero for council chambers, local constituents and suppliers. It means focusing on potential outcomes, translating standard percentage reductions and increases into ‘dates' and speeding up our understanding of what's been achieved - because a dial is a measure that everyone can understand. Councils need a simpler way to communicate progress and pinpoint to people at all levels of data literacy what still needs to be done, by when, by which local authority.
Digging deeper into the tracker by each individual local authority, the ‘intention-action' gap between ambitions and projections becomes (alarmingly) clear. The average gap between commitment and performance is a striking 30 years, based on 2017-21 analysis.
Progress at a glance
Back to the ‘one in five': where climate action plans do exist, most local authority websites lack consideration for their audiences. It's often difficult to find information. Where you do find it, it can be hard to understand or derive any real insight.
One solution is to emulate the City of London and create a climate action dashboard for staff, businesses and citizens to access their local picture at a glance. A dashboard pulls together once-disconnected data from across an organisation into one centralised place and reproduces it in consistent formats so the content can be shared on multiple platforms.
Armed with a practical data system, teams spend less time wrangling disparate data streams and more time implementing climate action plans.
For council officers in climate change, planning and procurement, delivering on net zero is becoming a greater responsibility, and becoming more time-consuming, an issue the tracker resolves by outlining performance in commercial energy, domestic energy, industry/manufacturing, agriculture, public sector and transport.
It may not seem like it, but there is plenty of money around to fund a Carbon Transition. Time, however, is a far scarcer resource. These new projected dates are a reminder of the urgent need to act now to remain within the capabilities of the planet to sustain us. Let's hope we start to see more delivery now that the sobering reality is ever clearer.

Stewart Pickering is Head of Sustainability at visual data design consultancy infogr8. Huw Bunn is co-founder of dedlyne, created to simplify sustainability understanding and communications.

