How good is your council at providing adult social care services? You almost certainly have a view, and others will have theirs. But what is striking is that there is no agreed definition of what ‘good' really means in this context, and not even many strong views about what that definition should be.
This is surprising for a system that impacts on more than two million lives and spends over £20bn every year. There is a degree of collusion in this confusion: many system and local leaders are complicit in not taking the opportunity to agree on what would count as ‘good' so that they can avoid being compared.
Why is this? Quite simply, some areas would of course end up looking worse than others. This would mean there would be disagreement and disappointment to work through and, as a result, there has not been a strong enough impetus to take this on.
As it stands, there is no regulation or assessment of the overall adult social care system.
The Care Quality Commission (CQC) inspects 22,000 separate adult social care providers and it has also evaluated 25 out of 150 ‘health and care systems'. But these system evaluations are not fully comprehensive. The official alternative to CQC assessment is the current system of sector-led improvement, which lacks both eyes and teeth (there is a lack of transparency, and there are no sanctions that can be used against poor performers).
Neither of these current approaches openly ask the question: ‘What are we achieving for the money we spend on adult social care?'
The problem with this is it means that the adult social care sector is never able to confidently argue that it is under-funded.
The classic Whitehall response to requests for more cash is to point to the variation between areas and argue that if some areas are performing much better than others with the money they have, then the problem is variation, rather than overall funding.
My view is that unless the sector is prepared to call out unacceptable variation, it will never be able to make a watertight case for more funding, or make the case for positive variation, where that is a strategic choice.
Getting councils to aim at being the best on every measure – for example on both reach and impact – misses the point that strategic decisions do need to be taken at a local level.
To stoke the debate, iMPOWER is publishing its latest list of the top 10 best councils in relation to adult social care, updating the ranking of 150 councils that we first published just over a year ago.
This work builds on the ranking tables included in our report Which Councils Are Best? (featured in The MJ, 22 November 2018). Those tables ranked overall council performance, whereas these latest ones look specifically at adult social care.
Redbridge LBC tops our 2019 rankings:
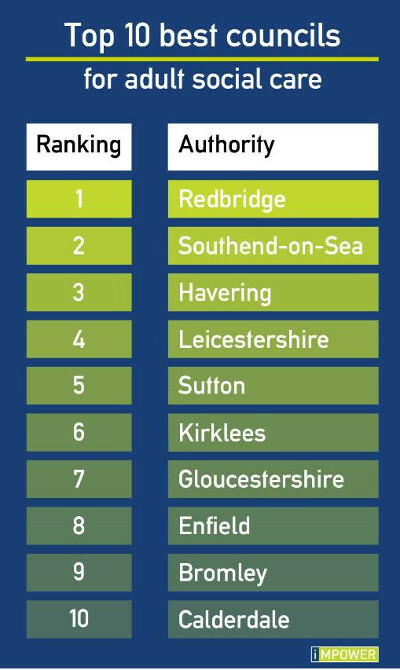
l–Four councils have retained their spot in the top 10: Redbridge LBC, Leicestershire CC, Kirklees MBC and Bromley LBC. Each of these authorities has demonstrated a continuing ability to achieve a combination of strong outcomes and low spending per head.
l–Among the new entrants to the top 10, two have made the list as a result of very significant improvements in productivity compared to last year: Enfield LBC in older adults and Gloucestershire CC in all age disability.
l–Seven of the top 10 councils bucked the national trend by under-spending their adult social care budgets in 2017/18 (by an average of £11m), proving that there is a strong relationship between better outcomes and financial control.
l–Four of the councils also feature in the top 10 list for overall council productivity as published in Which Councils Are Best?, showing that adult social care is a critical element for overall council performance. All the 10 councils listed above fall within the top 50 councils for overall council productivity.
l–While many policy-makers in central Government think that the most important thing that adult social care does is get people out of hospital quickly, not a single one of the 10 councils with the lowest delayed transfers of care rates are in the iMPOWER top 10. They are ranked between 12th and 136th place, illustrating that we take a very different view of what good adult social care is.
By publishing league tables, we want to encourage those working to improve public services to do three things. First, move the sector towards developing its own definition of what good adult social care is. Second, to widen the debate beyond simply the amount of money available to local government to what is being achieved with it: the outcomes achieved per pound spent. And third, to encourage councils to engage with debate about variation, in order to strengthen their case for increased funding.
If you would like to know more about the iNDEX, please contact iMPOWER.
Jeremy Cooper is director of iMPOWER
Footnote: iMPOWER'S approach measures performance against outcomes, per pound invested. Using the latest published national data, we examine performance using 25 indicators across three categories: older adults, all age disability, and the health and social care interface. These indicators include: for older adults, the percentage of carers who are neglecting themselves, and older adult residential/nursing care admissions; for all age disability, average Attainment 8 score for pupils with an education, health and care plan or statement, and percentage of adults under 65 with a disability who live in a care home; for the health and social care interface, unplanned hospitalisation for ambulatory care conditions, and percentage of new adult social care clients being admitted into a care home directly from hospital.