The publication of our annual Which Councils are Best? report, which includes a list of the top 10 most productive councils in England, has become one of the most widely-read evaluations of council performance. For some, it is an eagerly-anticipated moment in the local government calendar. Many councils are keen to understand where they are on the list and why, and those who make it into the top 10 are usually quick to celebrate.
We are pleased with this positive response as the whole purpose of compiling and publishing a top 10 list is to help the sector reframe what ‘good' looks like and to learn from and celebrate success. That applies to the 2019 list.
As in previous years, we aren't making available the list of all 149 upper tier councils in England or revealing the bottom 10. We have no interest in naming and shaming; our intention is to enable improvement and learning through celebrating best practice and to encourage the sector to develop its own definition of good performance. The debate about local government needs to move beyond the amount of money made available to what is actually being achieved with it for our citizens. Through the Impower Index, we define productivity as outcome value for every pound spent.
Using publicly available data, we measure performance against outcomes (per pound invested) through seven different lenses: children's social care; older people; all age disability; health and social care interface; housing and homelessness; waste and recycling; and – new for 2019 – children with high needs.
The Index scores each council for productivity through each lens and then ranks them. Councils in the top 10 list achieve greater than average outcomes from a less than average spend per head.
We continue to make ongoing improvements to the way we measure performance. While we value consistency in year-to-year measurement, we also want to continue enhancing the insight offered. Therefore as well as the addition of a new lens this year, a small number of measures have also changed.
We know that those working in the sector are constantly striving to deliver better outcomes, with goals such as helping people to live more independently, avoiding family breakdown and reducing homelessness. Achieving these would not only improve lives but would also result in reduced spending on acute services which are the most expensive. Some authorities do really well at this and we want to highlight their outstanding performance.
We make our analysis available to councils who request it on an individual basis, and show them how their performance compares with that of other local authorities with similar characteristics (their statistical neighbours). This helps them frame the right questions to ask to improve their performance, for example ‘what would it take to improve the effectiveness of our prevention investment so that we can see demand reducing for acute services?'
As we argue in our new book, The EDGEWORK Manifesto, all public service systems are complex. These systems do not have linear inputs leading to repeatable outputs. This makes measuring performance and comparing results between different organisations more difficult.
Many people respond to this challenge by narrowing down their focus to measure something very specific. But we have gone the other way and widened the lens. Only by looking at a broad range of outcome measures and by aggregating spending can we approximate the complex systems being run by local authorities. This EDGEWORK approach makes our analysis of productivity particularly powerful, because it shows that despite this complexity, some councils are significantly more productive than others, and are able to achieve better outcomes for people while also spending less money. Our list of the top 10 most productive councils celebrates their success.
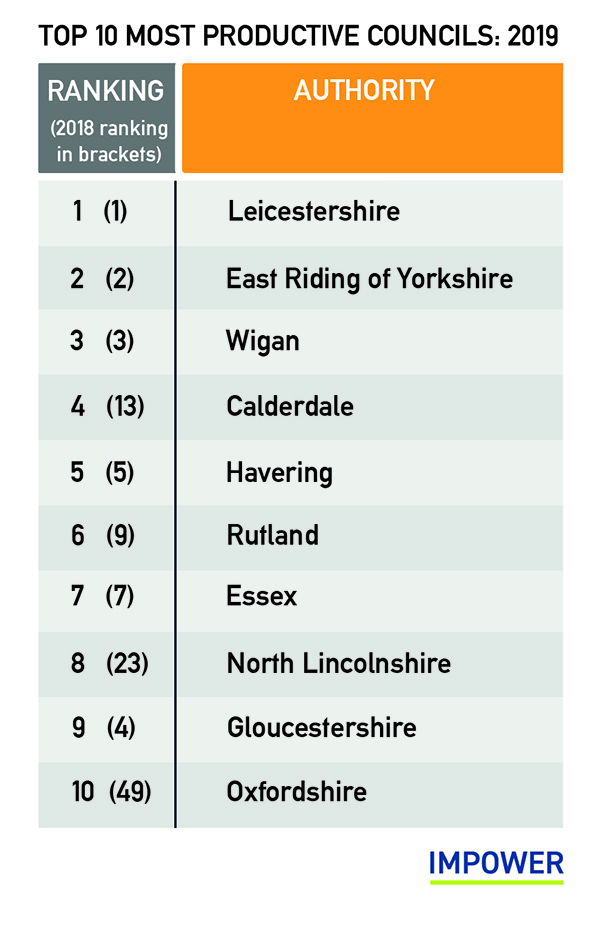
Top 10 most productive councils
Congratulations to Leicestershire, East Riding of Yorkshire and Wigan who have all retained their respective top three slots for the third year running. Calderdale has moved into fourth place, steadily progressing from being 17th in 2017 and 13th in 2018. Oxfordshire is the other newcomer to the top 10, while North Lincolnshire is back in the list after being ranked 23rd last year. Rutland has improved its position, while Wigan, Havering and Essex have all maintained their positions, and Gloucestershire has slipped slightly downwards.
Top 10 productivity rankings across the seven lenses
Across the seven lenses used to assess performance there are significant variations within individual authorities. For example, although Leicestershire is the most productive council overall, it ranks 53rd for children's social care. Gloucestershire has the largest range of variation, ranking 2nd for health and social care interface and 124th for children's social care.
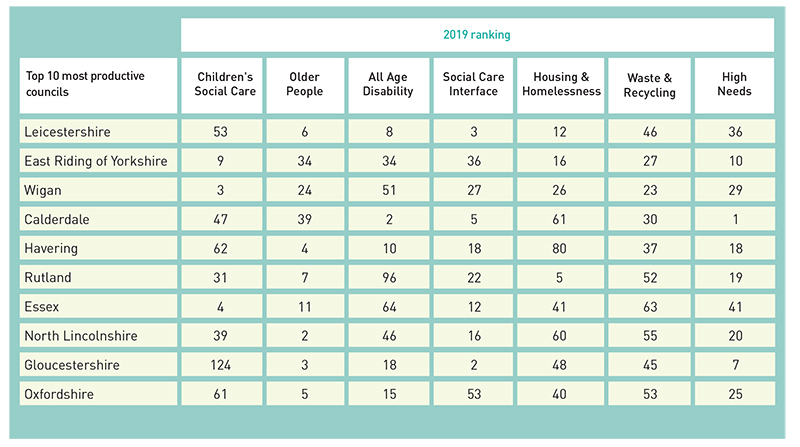
Calderdale's increase in overall performance has been boosted by ranking highly in the new high needs lens. All of the top 10 most productive councils, with the exception of Essex, rank in the top 25% of councils for outcomes for children with high needs.
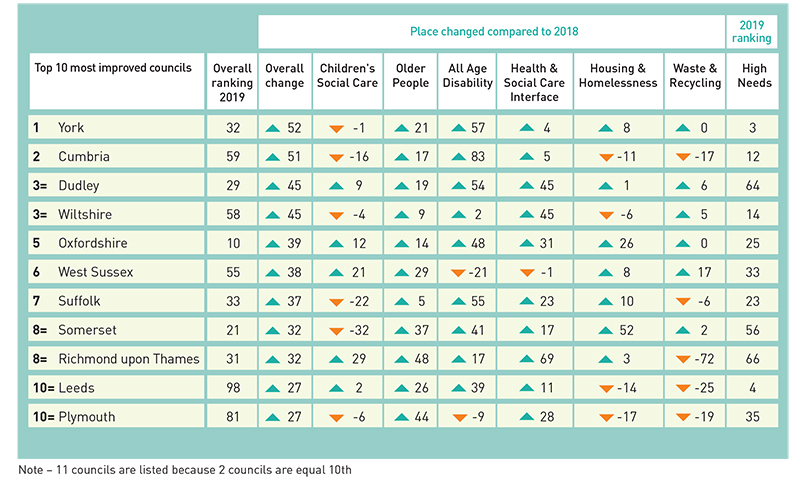
Top 10 most improved councils
We consider those councils who have increased their overall productivity ranking by the largest amount to be ‘most improved'. This year the most improved local authorities have all increased their overall ranking by 27 places or more. Those that made the most progress all improved their performance in at least half of the six original lenses, ranked well for the new high needs lens, and made improvements in the older people lens. The largest improvements took place in relation to all age disability, reflecting the increasing focus placed on social care outcomes by councils in recent years.
Three councils deserve a special mention for improving across all six original lenses: Dudley, Wolverhampton and Greenwich. Only four councils experienced a fall in performance across all six lenses.
The Impower Index is one part of our EDGEWORK approach which makes the case for a new approach to public sector leadership and a different type of consultancy support.
If you want to learn more about our perspective on how your council is performing, please get in touch or visit our stand at the upcoming National Children and Adult Services (NCAS) Conference.
Jon Ainger is director of Impower